As the US housing market continues to normalize after years of volatility, inventory levels are beginning to shift, though not uniformly. Some regions are seeing meaningful gains in available listings, while others remain tight due to persistent supply constraints. Understanding how inventory growth varies by state is critical for buyers, sellers, and investors navigating today’s evolving real estate landscape.
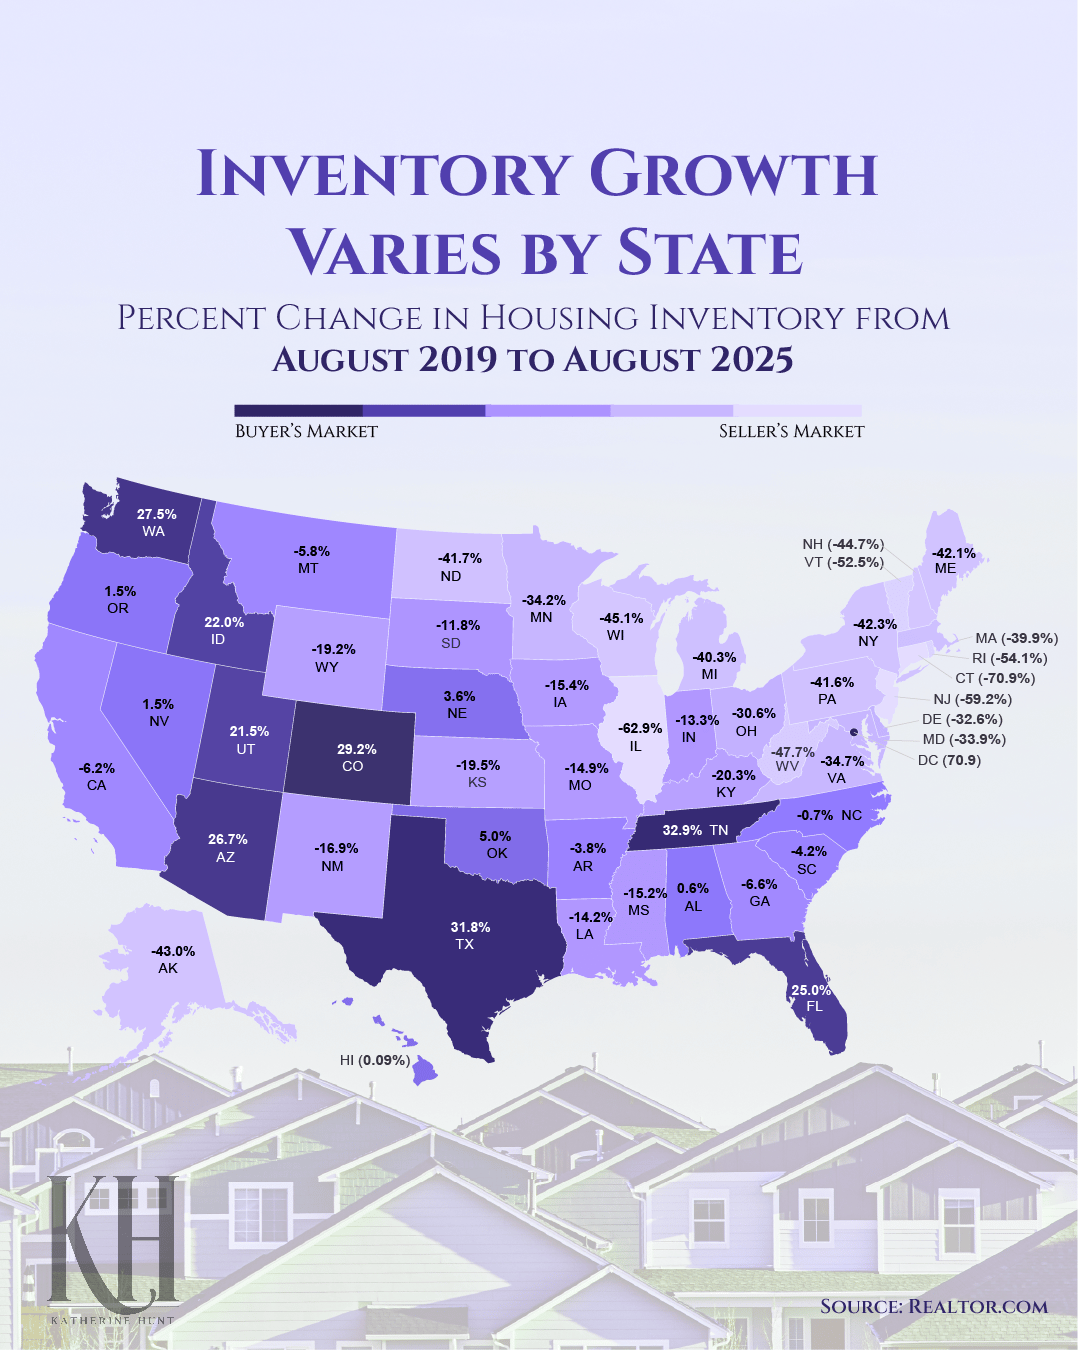
States with the Highest Inventory Growth (Buyer's Markets):
• Tennessee: +32.9%
• Texas: +31.8%
• Colorado: +29.2%
• Washington: +27.5%
• Arizona: +26.7%
• Florida: +25.0%
• Idaho: +22.0%
• Utah: +21.5%
States with the Biggest Inventory Declines (Seller's Markets):
• Connecticut: -70.9%
• New Jersey: -59.2%
• Rhode Island: -54.1%
• Vermont: -52.5%
• New Hampshire: -44.7%
• Alaska: -43.0%
• North Dakota: -41.7%
• Massachusetts: -39.9%
U.S. Existing-Home Sales by Region
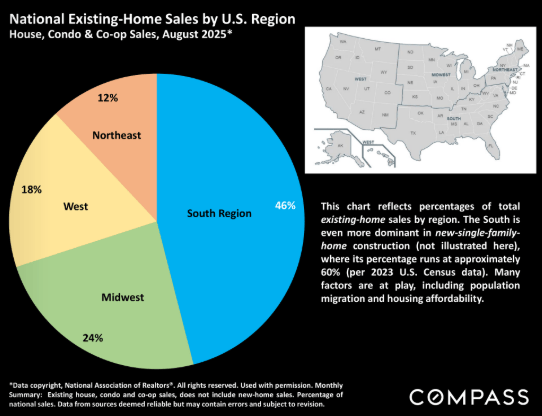
The chart shows the percentage of existing-home sales (including houses, condos, and co-ops) across major U.S. regions in August 2025. The South dominates the market, fueled by strong job growth, migration, and relatively lower home prices. Northeast and West are seeing reduced sales share, likely due to affordability constraints and slower population growth. Midwest remains steady, with a quarter of national activity, attractive for first-time buyers and remote workers.
Ready to Navigate the Market?
For buyers, these inventory shifts may signal new opportunities in states with rising supply. For sellers in tight markets, shrinking inventory could mean stronger negotiating power. Regardless of where you live, understanding these trends is key to navigating today’s housing landscape.
As always, don’t hesitate to reach out for guidance.
