Blog

2025 Silicon Valley Real Estate Market Recap


Here is a data-driven presentation highlighting key trends, pricing dynamics, inventory shifts, and buyer-seller behavior that shaped Silicon Valley's housing market in 2025- essential insights for navigating 2026.
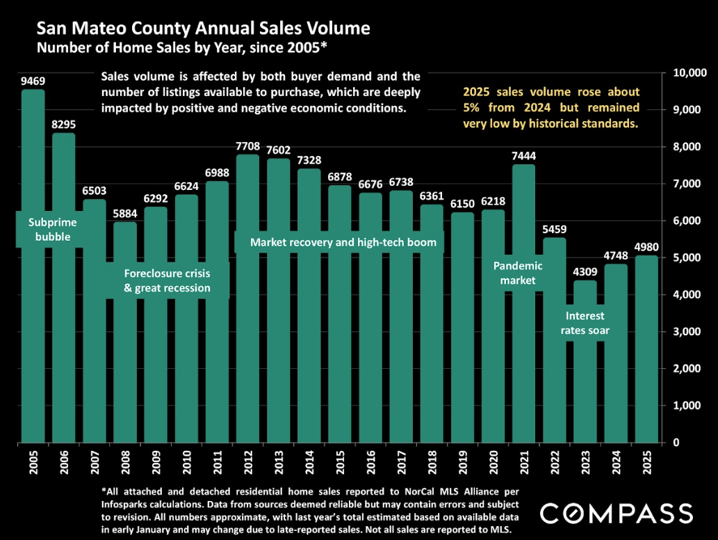
 

San Mateo County home sales chart, 2005–2025, with teal bars and annotations for major market periods.

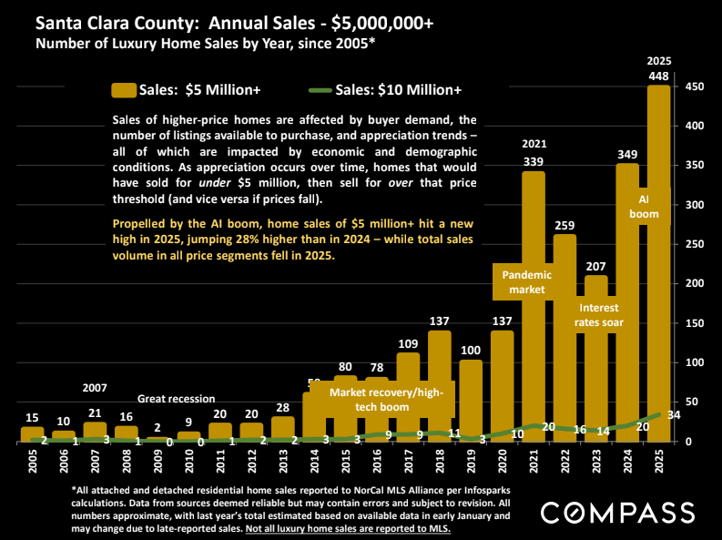
Chart of Santa Clara County luxury home sales from 2005 to 2025, reaching a high of 448 sales in 2025.

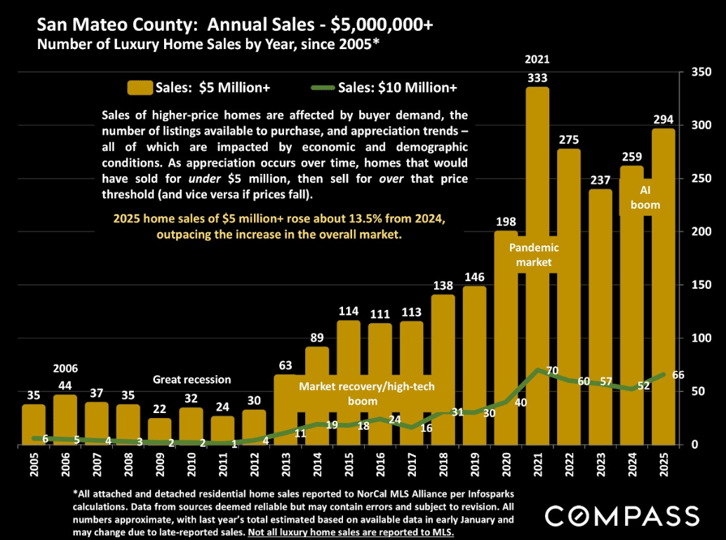
Chart of San Mateo County luxury home sales from 2005 to 2025, with 2025 sales up about 13.5%.

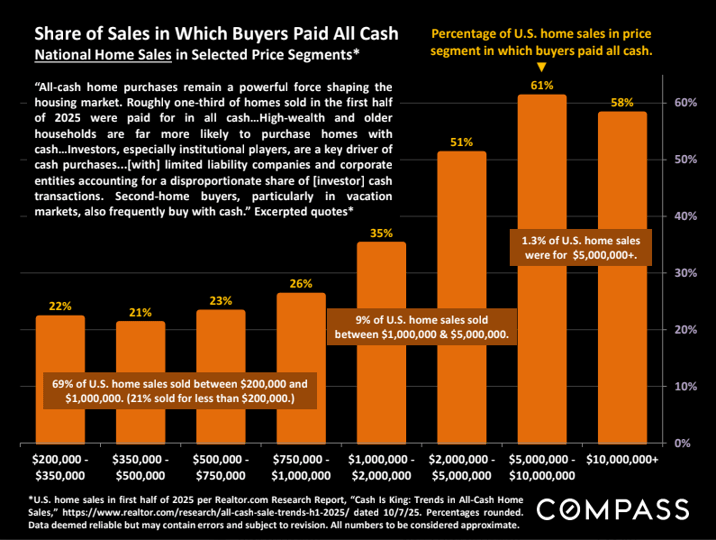
All-cash home sale percentages by price range, with the highest share—61%—for $5–10 million homes.

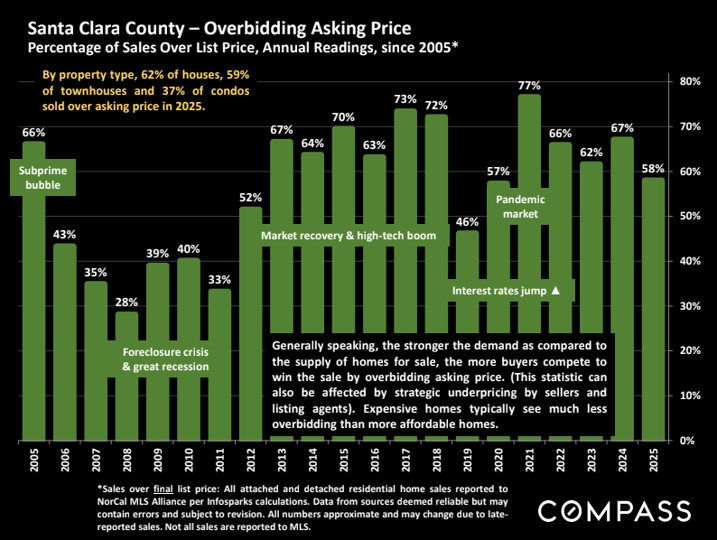
Bar chart showing Santa Clara County home sales over asking price from 2005 to 2025.

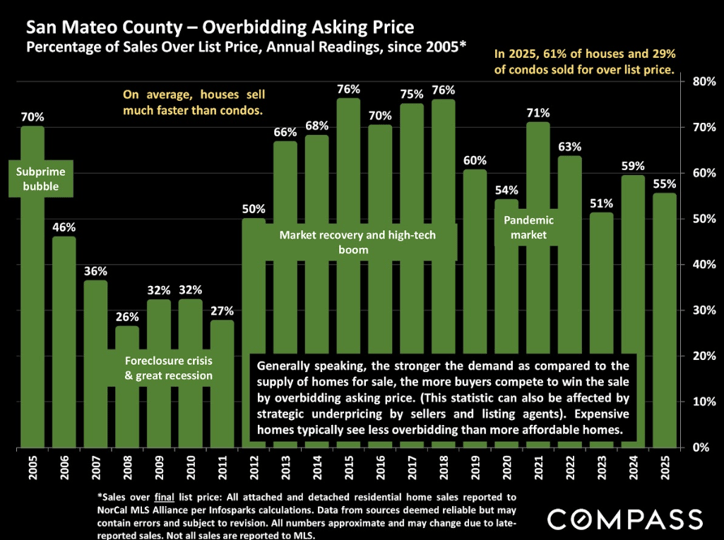
San Mateo County chart of annual sales over list price, with a 55% rate in 2025 and market-period annotations.

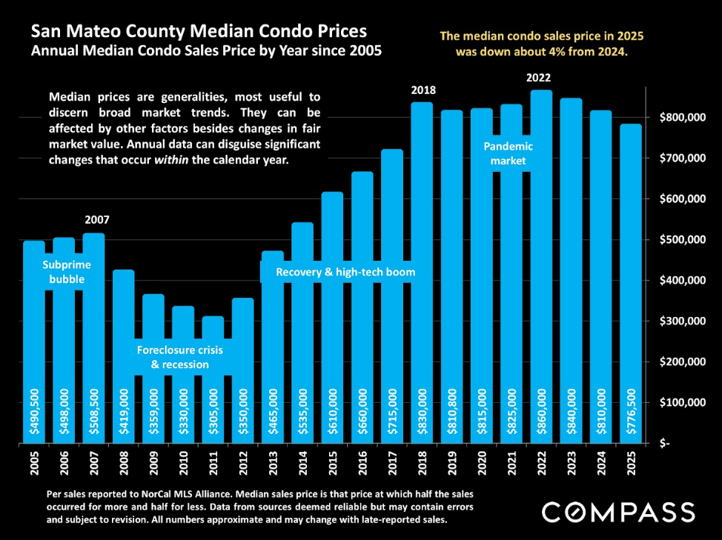
Chart of San Mateo County median condo prices, 2005–2025, showing a 4% decline in 2025.

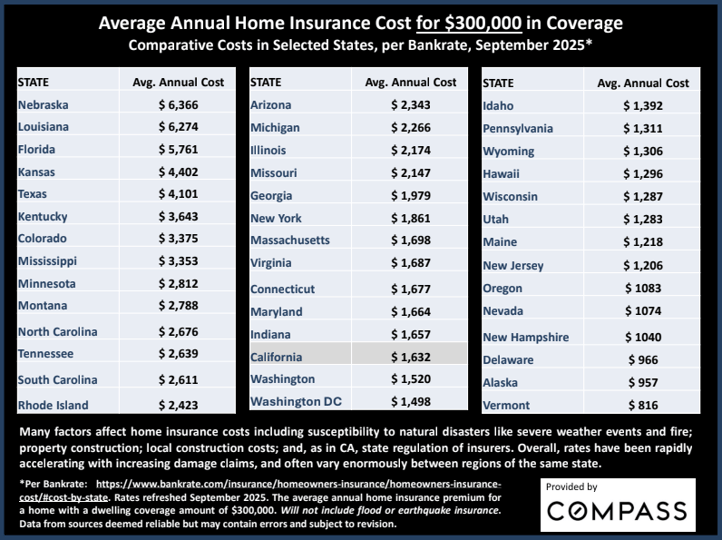
Infographic comparing annual $300,000 home insurance costs by state; California is listed at $1,632.


Subscribe to my newsletter to discover why homeownership still pays off, profitable home upgrades, elections' impact on housing and other latest SV insights.

Work With Katherine

Real Estate Expert Katherine Hunt has been a licensed real estate agent in Silicon Valley for over 29 years. She offers skill and experience with residential property, investment property, new construction, and 1031 exchanges.
Let's Connect
Follow Us